WIRIS Data SDK tutorial

WIRIS Data SDK tutorial

Linking Wiris Data SDK to a Visual Studio C++ Project

1.  Open Visual Studio and create new project: File -> New -> Project -> Visual C++

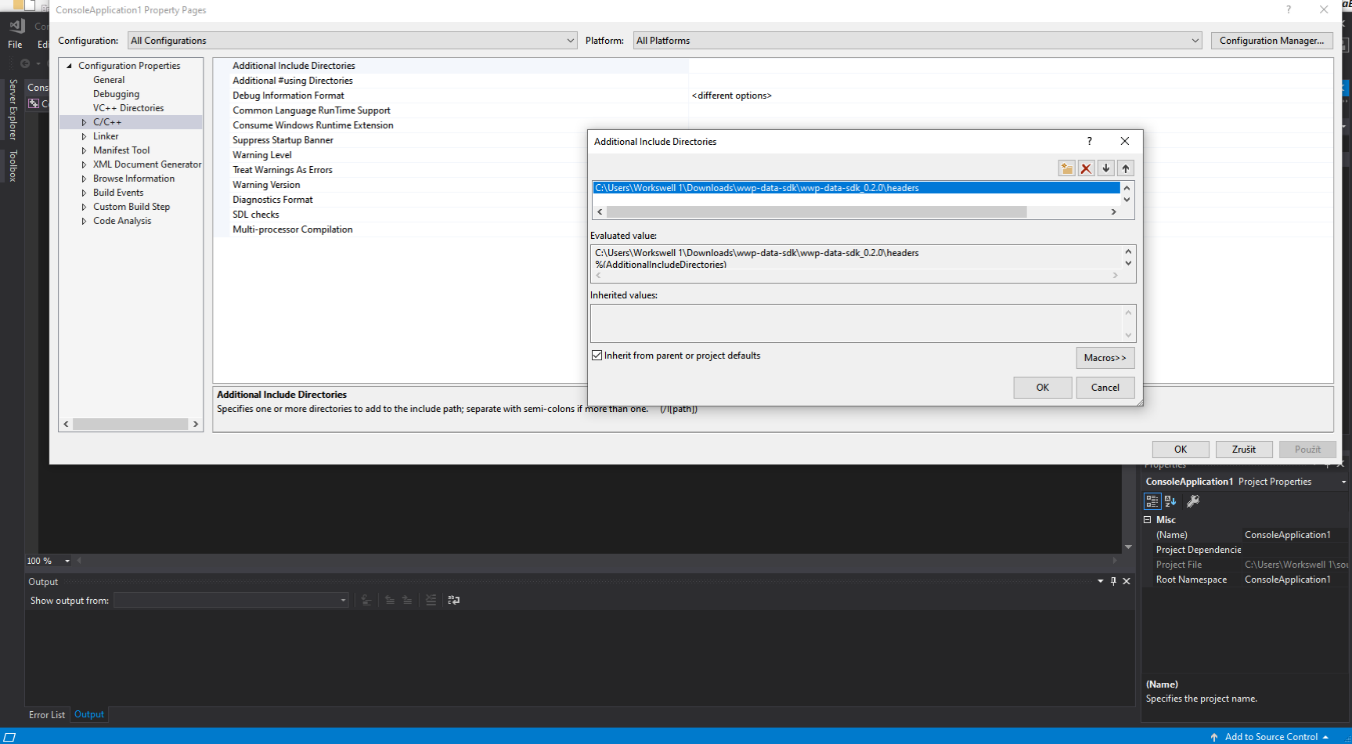
2.  Link the SDK’s header files:

a. Open Project properties: Project -> Properties.

b. Open C/C++ tab and choose

c. Click on Additional Include Directories text field and open dialog using the arrow down icon and choose Edit from the dropdown menu.

Use the dialog to navigate to the headers which are located in your SDK folder.

Figure 1. Adding SDK headers to Additional Include Directories Figure 1. Adding SDK headers to Additional Include Directories

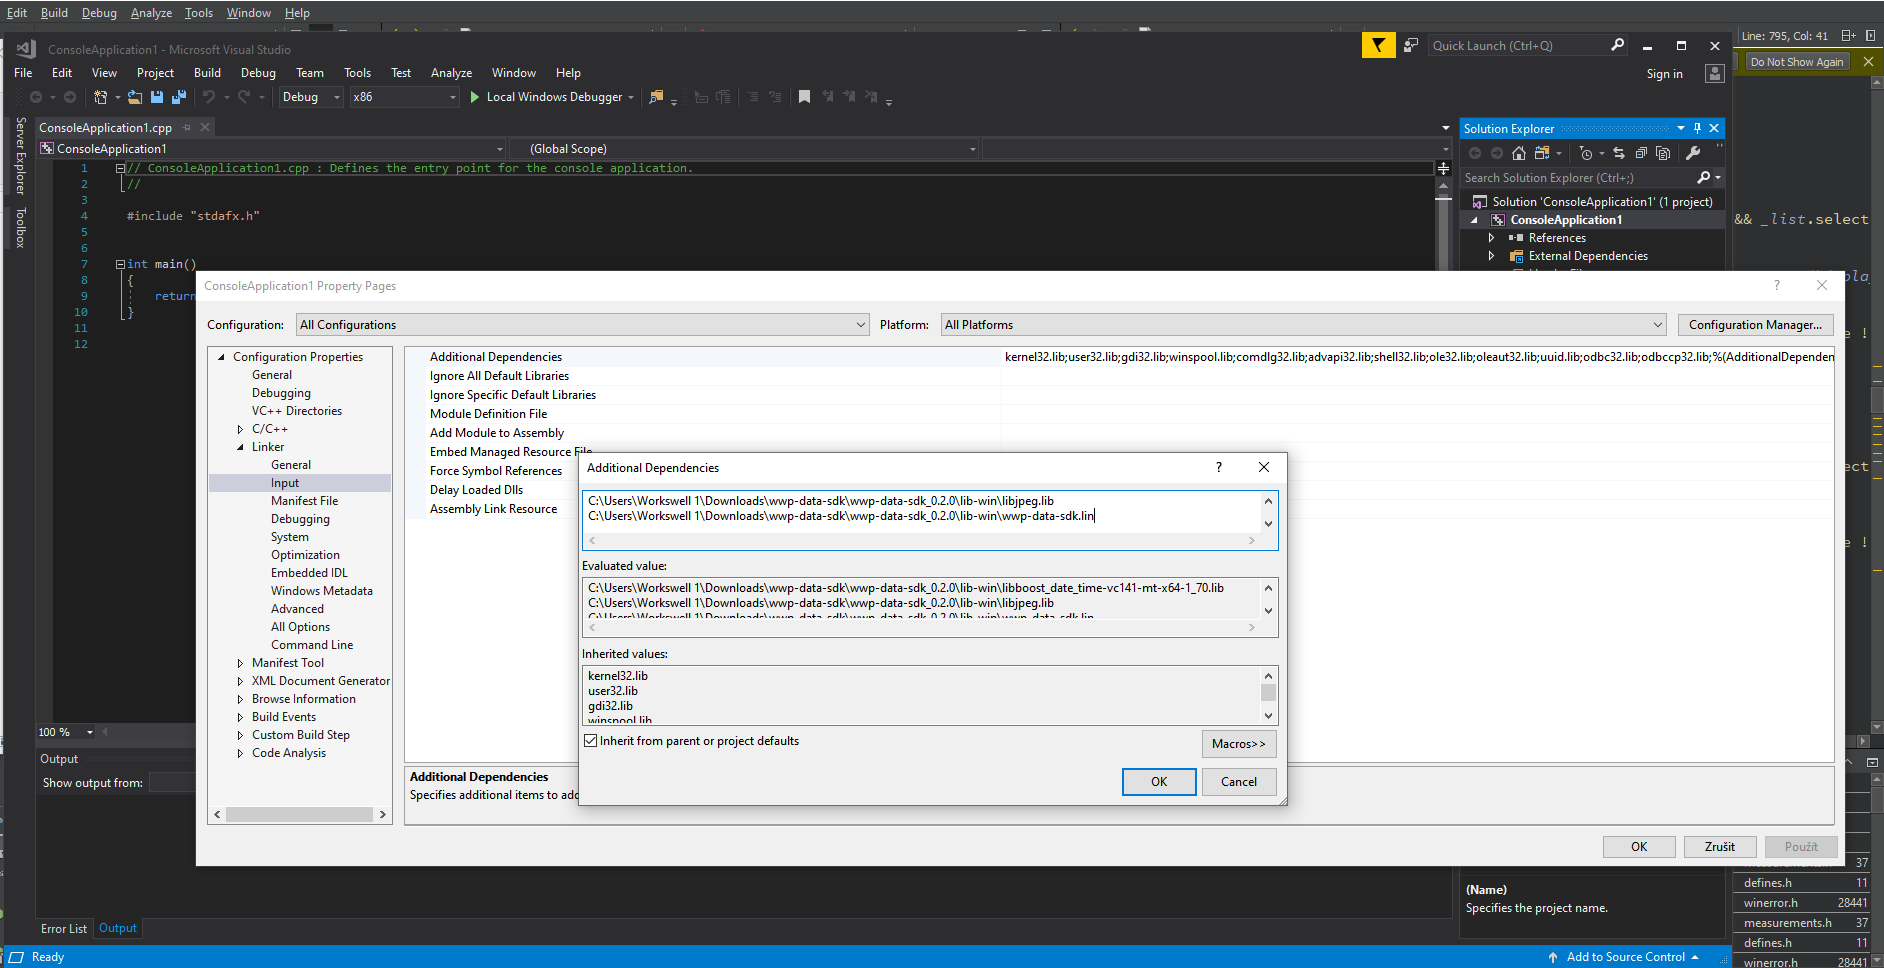
3.  Link the pre-compiled SDK files:

a.  Open Project properties: Project -> Properties.

b.  Open the Linker tab and choose

c.  Click on the Additional Dependencies text field, open dialog using the arrow down icon, and choose Edit from the drop-down menu.

d.  Insert path for all binary files found in the lib-win directory within the SDK.

Figure 2. Adding SDK binaries to linker Additional Dependencies. Figure 2. Adding SDK binaries to linker Additional Dependencies.


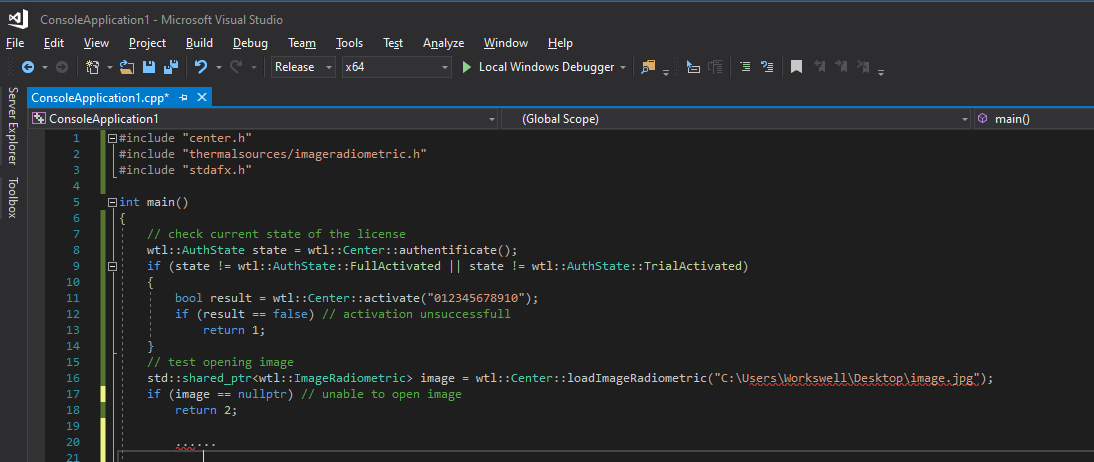
4. Project Compilation and Licensing:

a.  Make sure you compile the project in release mode with a 64bit compiler.

b.  Include the file h, which is the entrypoint of the SDK.

c.  Activate your license serial number – you need your SDK copy – by calling function wtl::Center::Activate(serialNumber). This requires an internet connection.

d.  After the activation, the license file is saved to your computer. You can use the function wtl::Center::Authenticate to check the state of your license.

e.  After the activation, you will be able to work with thermograms and sequences.

Figure 3. Sample code for SDK activation. Figure 3. Sample code for SDK activation.

Using Wiris Data SDK in a Visual Studio C++ Project

1. Please refer to the Linking Wiris Data SDK to a Visual Studio C++ Project tutorial to get information about setting up the project and licensing.

2. Loading thermograms stored on your file system is done using the methods wtl::Center::loadImageRadiometric(path) and wtl::Center::loadSequenceeRadiometric(path), which return the shared pointer to the created thermogram instance.

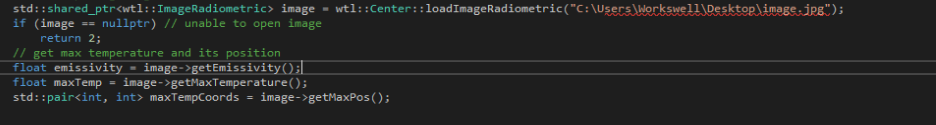
3. Read temperatures, radiometric values or parameters from the thermogram.

Figure 1. Sample Code for reading emissivity and maximum temperature of thermogram. Figure 1. Sample Code for reading the emissivity and maximum temperature of thermogram.

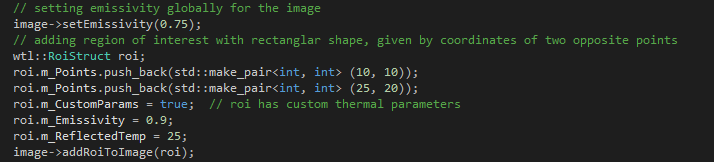
4. Modify thermogram parameters and add measurements using ImageRadiometric or SequenceRadiometric methods.

Figure 2. Sample Code for adding roi to thermogram. Figure 2. Sample Code for adding roi to thermogram.

5. Change the appearance of the thermogram – choose the palette to be used or change the temperature range, view your image data, or save it to the filesystem.

Figure 3. Changing palette and saving thermogram. Figure 3. Changing palette and saving thermogram.

6. If you want to present the image in your application‘s GUI, use the method ImageRadiometric::getRGBArrayRepresentation(data). It will calculate RGB values using temperature in each pixel and colors from the palette and save them to memory as given by the parameter.

Github sample: https://github.com/SoftwareWorkswell/wwp-data-sdk-sample