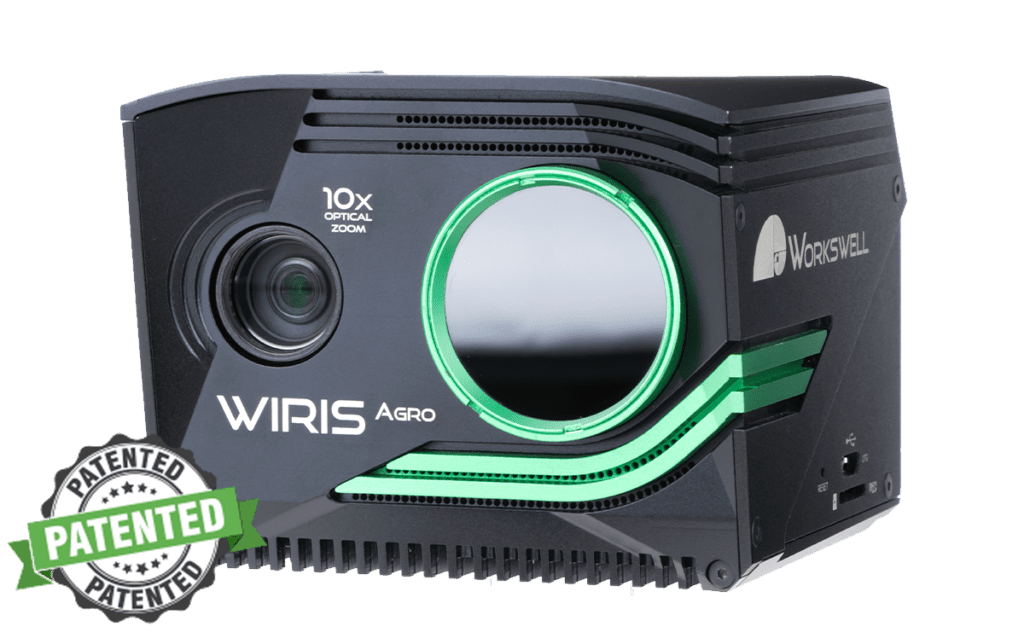
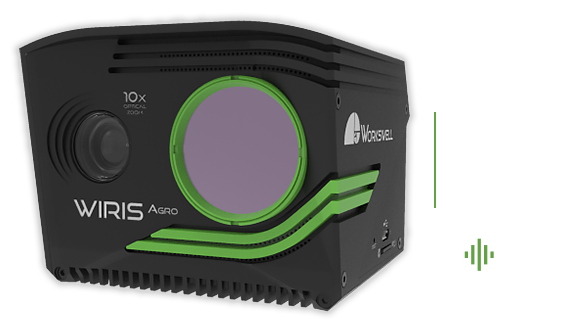
WIRIS Agro
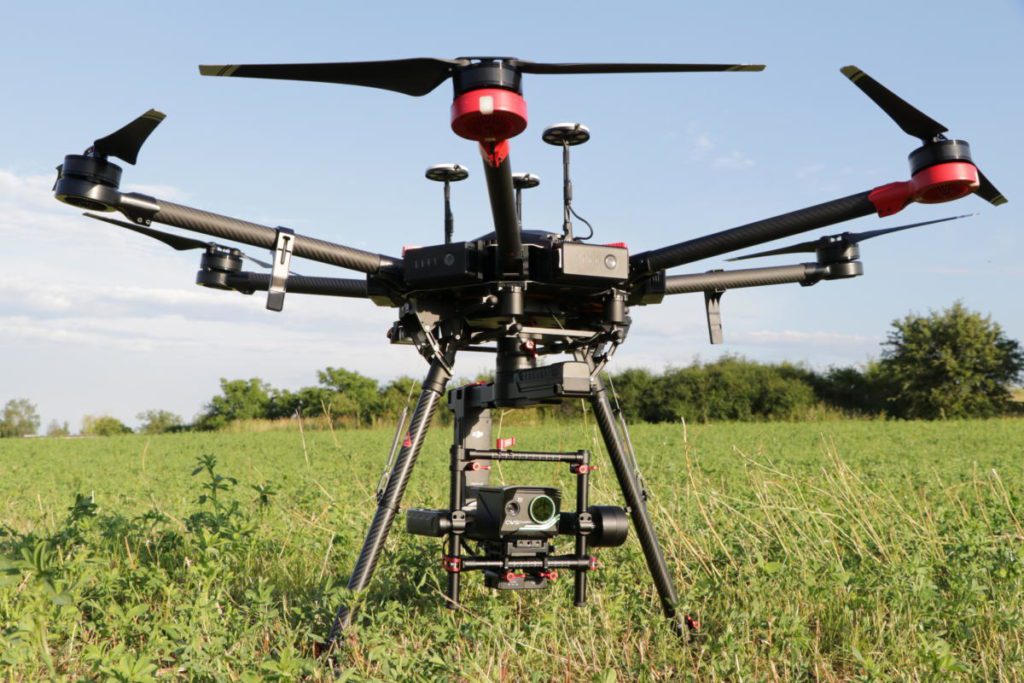
Workswell WIRIS Agro R is the first device of its kind. Designed to map water stress across large areas, it has a critical role to play in the field of precision agriculture. The device facilitates the determination of the water stress value in a given stand of plants. This information may then be used to determine yield maps, optimize irrigation, and control water management remedies. In addition, the camera offers an LWIR band sensor with radiometric measurement and 10x optical zoom RGB camera with full HD (1920 x 1080 px) resolution for biomass cover index evaluation.

Crop Drought - Actual and Real Value
In 1981, the crop water stress index (CWSI) was developed as a normalized index to quantify water stress without interference from other environmental parameters affecting plant stress, such as temperature. In the dry season, precision farmers want to know the actual effect of drought on their crops. However, this can be difficult to measure. For example, crops may respond differently to drought if they have access to groundwater, and each plant has a different root system. These factors make it hard to tell how much a particular crop might be suffering during a given drought. That’s where the Workswell WIRIS Agro comes in. This thermal camera makes real-time measurements of the actual effects of drought on a crop.


Main WIRIS Agro R Applications
Although there are many uses, we can divide the main WIRIS Agro R functions into these four categories:
CWSI
Crop Water Stress Index
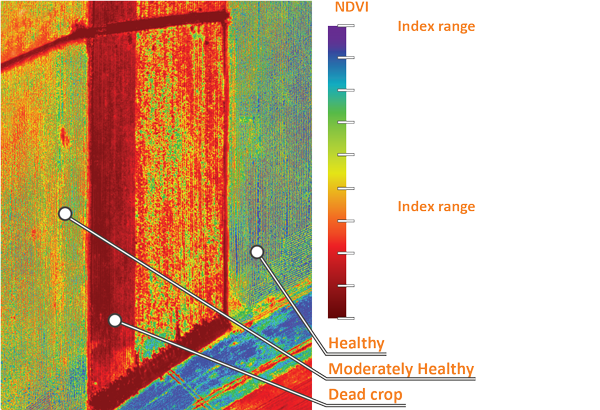
NDVI
Normalized Differential Vegetation Index
Download a PDF document with a full comparison of many other features of CWSI and NDVI.


Real-time Evaluation
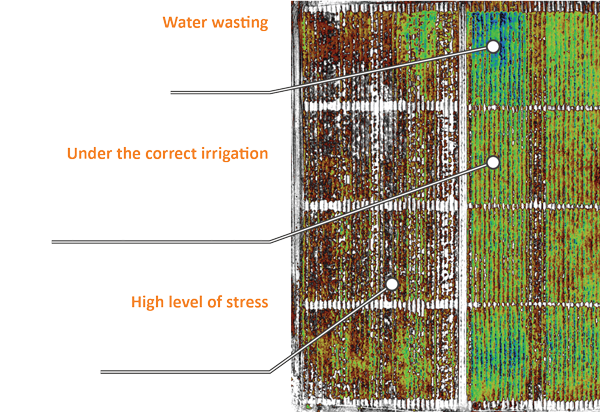
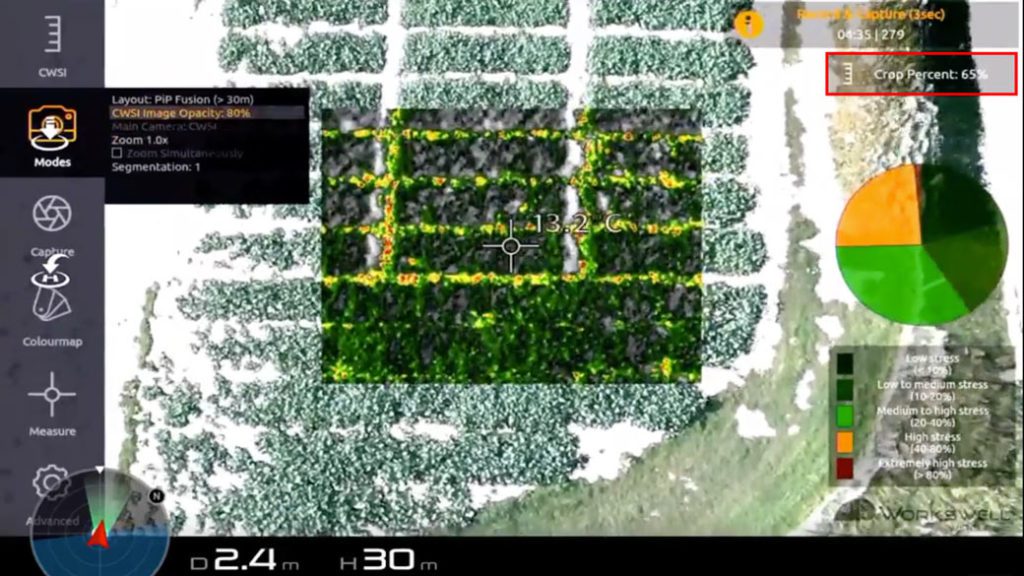
With the WIRIS Agro R, you get actual values of crop water stress during the flight, and you can use the collected data to create an overview map for later review. By comparing yields from different months and years depending on water stress, a potential yield map can be created according to the current water stress value.
This map provides:
-real-time onboard CWSI evaluation
-real-time CROP and WATER color map vizualization
-real-time additional information on how the crop is impacted by drought
-real-time Biomass cover index evaluation in %
-real-time Picture-in-Picture CWSI index and RGB
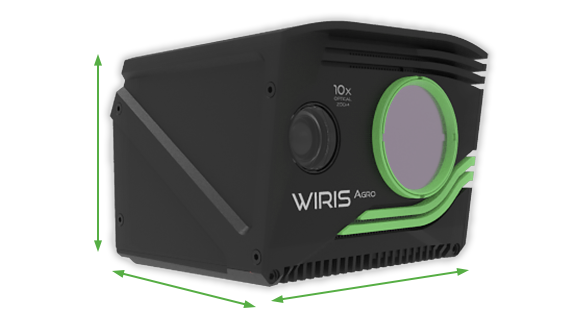
Ensconced in a rugged case of lightweight aluminum. What’s more, the most sensitive component of the entire system, the thermal camera lens, is protected by a replaceable protective cap made of germanium.
High Measurement Accuracy and Precision Metrology
We know that when it comes to metrology, agricultural applications can be very demanding. That’s why we ensure the accuracy of our devices through the separate calibration of each lens, and issue a final calibration certificate with each camera we deliver. Each thermal camera is individually manufactured and precisely calibrated.
Are you interested?
CorePlayer Desktop Analysis Software for the Evaluation of CWSI Data
The CorePlayer CWSI Analysis Software is a desktop software used for processing, analyzing, and exporting CWSI RAW data images and videos. It allows the user to set a variety of parameters and models that are necessary for the correct calculation of the CWSI Index, and it facilitates later processing if the input data sent to the camera needs to be adjusted.
For data processing into 2D or 3D visualizations, we recommend the most commonly used SW tools such as Pix4D and Agisoft. Each image or video frame shot with the Agro R includes GPS information for processing.
The software is supplied free of charge with the WIRIS Agro R.
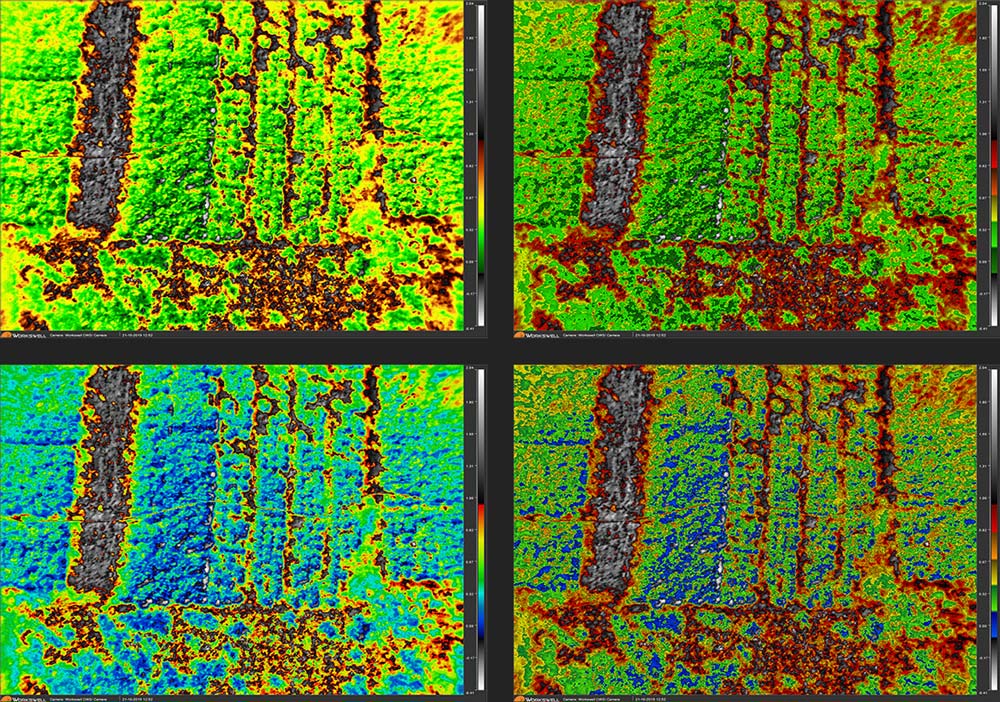
Color Map Overview
The WIRIS Agro R offers four different color maps. In terms of data processing, it is not important which map you choose, but from the application perspective, a suitable palette choice can be very helpful.
Each color map in the WIRIS Agro R camera is defined as follows: the palette is black and white as you move away from the 0 value (negative values below the range), and away from the 100% value (values above the range).
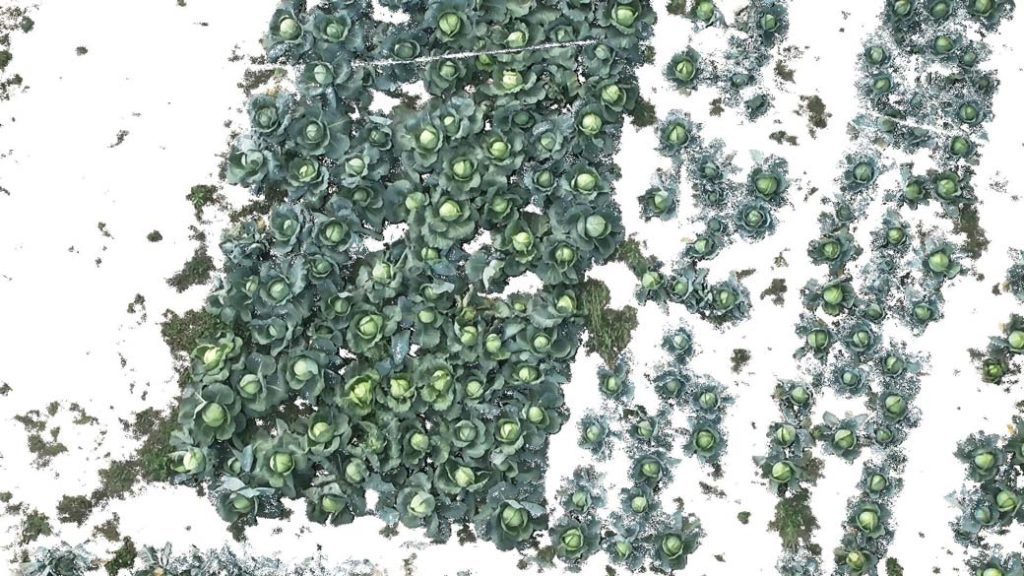
Biomass Cover Index
The BCI (Biomass Cover Index) concerns the evaluation of the vegetation mass within the RGB scene. Surfaces containing green vegetation are evaluated using data from an RGB camera, and the percentage of these areas is compared to other (non-vegetated) areas that are masked by a white color in the RGB image. The BCI is adjustable via simple thresholding by the user.
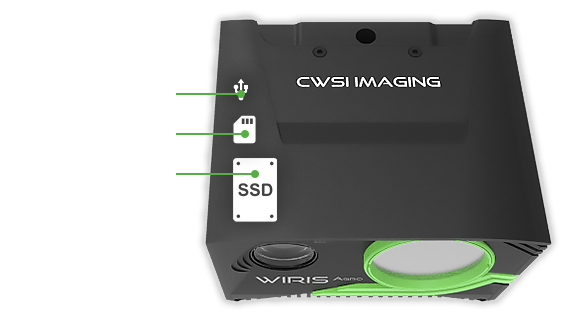
128 GB SSD disk, external USB disk or microSD card
Workswell WIRIS Agro R is equipped with an internal SSD with 128 GB memory for recording. You can also save data to an external USB disk or microSD card.
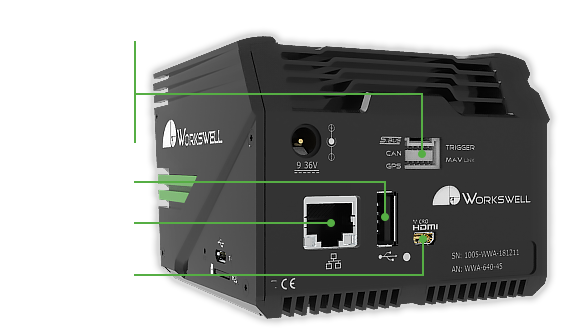
Interfaces
The Workswell WIRIS Agro R offers an interface enabling the widest range of connections to the drone, the control unit, an external GPS sensor, and other instruments. A Wi-Fi low latency live video streaming and command link is also available. The following HW interfaces are standard:
S.BUS
CAN bus (DJI M600 and A3 controller compatible)
Ethernet (RJ 45 with RTPS streaming and control signals transmission option)
MavLink – Provides a wide range of standard and custom commands for controlling the thermal camera during the flight.
external GPS connection
External trigger
Weight and dimensions
Workswell's WIRIS Agro R weighs less than 430 g, which is very convenient for drone usage.
WEIGHT: < 430 g (0.95 lb)
DIMENSIONS : 83 x 85 x 68 mm (3.26 in x 3.34 in x 2.67 in)

Gallery
Do you have any questions?
Please don’t hesitate to contact me if you need further information.
Other information
| WIRIS Agro key features description | |
| CWSI onboard processing | Evaluation of Crop Water Stress Index (CWSI) onboard in real-time |
| Operating onboard system | CWSI OS for full real-time data streaming and evalution during the flight – operating system ensures the full access to all camera functions – easy camera control via S.Bus, CAN bus, MavLink, RJ-45 or Trigger |
| Biomass cover index in % | Real-time percentage calculation of the mass of the vegetation in RGB |
| WIRIS Agro specification | |
| Sensor resolution | 640 x 512 pixels |
| Real-time CWSI evaluation | Workswell patented WIRIS Agro technology based on crop water stress index (normalized to value from 0 to 1) brings information about the crop stress and crop water management on large areas. The information can then be used to determine yield maps, manage irrigation or implement water management related remedies. |
| FPA active sensor size | 1.088 x 0.8705 cm |
| Type of sensor | LWIR band sensor |
| CWSI evaluation range | 0 – 100% (100% means very stressed) |
| Temperature sensitivity | 0.03 °C (30 mK) |
| Field of view of the lens | 45° |
| Color maps | 4 color maps for CWSI and Water management evaluation |
| CWSI range settings | Automatic or manual |
| CWSI digital zoom | 1 – 14x continuous |
| Software CorePlayer | Yes, included in the package 2 licenses |
| 3D mapping SW compatibility | Agrisoft and Pix4D |
| 10x Optical zoom digital visual camera | |
| Resolution | 1 920 x 1 080 pixels (Full HD), 1/3” sensor, Auto white balance, Wide dynamic range, Backlight compensation, Exposure and Gamma control |
| Optical zoom | 10x optical zoom with vibration compensation |
| View angle | Ultra zoom 6.9° – extra wide 58.2°, focal 33.0 mm – 3.3 mm |
| Biomass cover index | Calculation of the index in real-time with Threshold function |
| Focus | Autofocus with Direct Focus Zoom synchronization |
| Memory and data recording | |
| Memory | Internal high-speed SSD 128 GB for image and video recording External slot for Micro SD card & USB 2.0 for USB stick for taking images |
| Image and video formats | CWSI JPEG images and Digital camera Full HD JPEG images Digital camera h.264 encode video HD recording Full-frame CWSI video recording (raw data recording) |
| GPS geo-tagging (image & video) | |
| GPS tagging (image & video) | MavLink or External GPS or DJI A3 controllers compatible via CAN bus |
| Interfaces & real-time remote control | |
| 10-pin digital port | S.Bus CAN bus (compatible with DJI M600 and A3 controllers) MavLink External GPS connectivity External trigger |
| Ethernet (RJ-45) port | Video streaming and camera control (optional on request only) |
| Micro USB 2.0 port | Mass storage Camera control and video streaming (optional on request only) |
| USB 2.0 port | Keyboard connection for in-house WIRIS camera control |
| Remote control system | CWSI OS ensures real-time control of all camera functions during the flight |
| Remote control options | S.BUS protocol CAN bus for real-time control on DJI M600 and GPS geo-tagging RJ-45 for wireless uplink installation (video streaming and camera control) |
| Protective filter on lens | Filter protects the lens against external damage during the flight |
| Camera functions | Measurement functions: – online CWSI evaluation including 4 different color maps – spot CWSI evaluation (Centre) with temperature information – biomass index evaluation in percentage in real-time Periodic capturing: – capturing CWSI image, CWSI video and Visible image simultaneously |
| Camera modes visualization | Picture-in-Picture, Full Screen RGB with segmentation, Dual-screen |
| Micro HDMI video output | 1 280 x 720 pixels (720p), Aspect ratio 16:9, Micro HDMI video output |
| Software & SDK | |
| Desktop software | Advanced Workswell CorePlayer for offline CWSI data analysis |
| Power supply, weight & dimensions | |
| Input supply voltage | 9 – 36 VDC, Coaxial 2 x 6.4 mm, outer shell – GND |
| Power dissipation (avg.) | 12 W |
| Weight | < 430 grams |
| Dimensions (L x W x H) | 83 mm x 85 mm x 68 mm |
| Mounting | 2 x 1/4-20 UNC thread (1x bottom side, 1x upper side) |
| Housing material | Durable aluminium body for long-time measurement stability |
| Environmental | |
| Operating temperature range | -10 °C to +50 °C |
| Storage temperature range | -30 °C to +60 °C |